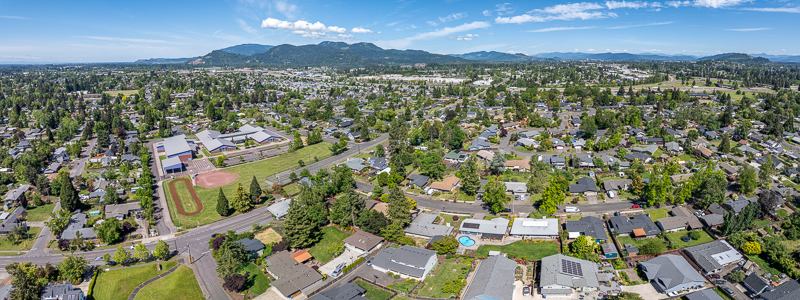
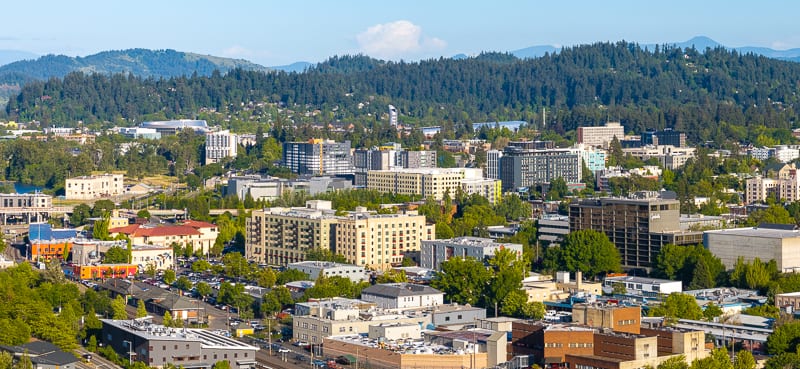
The average home price in Eugene, Oregon was $583,800 in September 2026, and the median home price was $520,000. Eugene stayed a soft seller’s market at 2.3 months of supply, with homes taking 45 days on average to go under contract.
- Average home price
- $583,800
- Median home price
- $520,000
- Homes sold (Sept)
- 147
- Days on market
- 45 avg20 median
- Sold vs. asking price
- 99.4%
- Months of supply
- 2.3
September 2026 · Eugene single-family homes · updated monthly
Welcome to our Eugene Housing Market Data page, a comprehensive resource designed to keep you informed about the latest trends and statistics in Eugene's real estate market. Whether you're planning to buy your next home in Eugene or sell your home with our 1.95% Listing Advantage, understanding the current market dynamics is crucial for making informed decisions. Each month, we'll analyze key real estate metrics and summarize their implications for our local housing market, providing you with a clear picture of what's happening in Eugene's housing landscape. Our data comes from our local MLS, ensuring that both buyers and sellers have access to accurate and relevant information. Stay tuned for our monthly updates and insights, empowering you to make the best real estate choices in Eugene.
* Excluded from the real estate data are: land without dwellings, condos, townhomes, mobile homes
September 2026
The Eugene, Oregon housing market held in Soft Seller's territory in September 2026 at 2.3 months of inventory, a little looser than August's 2.2. Sellers closed 147 single-family homes during the month, fewer than August's 154, and the typical Eugene home sold at 99.4% of its final asking price.
The pace slowed while prices firmed. Active listings held near 396 (391 in August), and homes under contract slipped to 150 from 181. Homes that sold took longer: average days on market rose to 45 from 39, and 62.6% sold within 30 days (down from 63.6%).
The average home price in Eugene rose to $583,800 from $556,434 in August, and the median home price rose to $520,000 from $500,750. Price per square foot eased to $305 from $313, so more of September's sales were larger homes, rather than every house gaining value. 97401 and 97404 stayed Eugene's tightest ZIP codes, 97405 and 97408 moved into Balanced territory, and 97402 gave buyers the most time, at 69 average days on market.
By ZIP code
Citywide numbers blend very different neighborhoods. In September 2026, which part of Eugene you're in still changes the plan for buying or selling.
97401 (central and northeast Eugene, including Cal Young and Ferry Street Bridge) was September's tightest corner: 1.4 months of supply and a Healthy Seller's Market. Twenty-four homes closed at a median of $700,000, and 75% sold within 30 days. Browse current Eugene homes for sale.
97404 (north Eugene and the Santa Clara corridor) stayed a Healthy Seller's Market at 1.8 months of supply, with 32 closings at 99.8% of asking. Homes there took longer to go under contract than in August, though: 56 days on average, up from 30.
97405 (south Eugene and the south hills) carries the most inventory in the city at 129 active listings, and it moved into a Balanced Market at 2.8 months of supply. The average sold price was $653,738, and the typical home closed just under asking at 98.9%.
97402 (west Eugene) gave buyers the most time: average days on market reached 69, and fewer than half the homes (48.4%) sold within 30 days. Even so, 38.7% closed above asking, so a well-priced house there still draws competition.
97403 (south Eugene, including Fairmount and the Southeast neighborhood) and 97408 (north Gilham and the Coburg Road area) both read Balanced, on small samples of 9 and 13 closings. Treat their averages as directional.
For context on the wider region, the Lane County housing market report tracks conditions across the county, and the Springfield housing market update covers the city next door. If you're weighing Eugene against a move north, the Eugene vs. Portland real estate comparison is also worth a read. Questions about what these numbers mean for you? Connect with us directly. We pull these figures monthly from our local MLS, so you're working from the same numbers your agent is.
| Eugene Zip | Active | Pending | Sold (Sept) | Months Supply | Market | List vs. Sold | Avg Sold | $/Sq Ft | Avg DOM | % Sold <30 Days | % Above List |
|---|---|---|---|---|---|---|---|---|---|---|---|
| Eugene (All) | 396 | 150 | 147 | 2.3 | Soft Seller's | 99.4% | $583,800 | $305 | 45 | 62.6% | 32.7% |
| 97401 | 40 | 25 | 24 | 1.4 | Healthy Seller's | 99.9% | $668,905 | $311 | 35 | 75.0% | 29.2% |
| 97402 | 99 | 37 | 31 | 2.6 | Balanced | 99.1% | $430,643 | $268 | 69 | 48.4% | 38.7% |
| 97403† | 24 | 7 | 9 | 3.4 | Balanced | 99.2% | $596,367 | $392 | 38 | 77.8% | 55.6% |
| 97404 | 65 | 27 | 32 | 1.8 | Healthy Seller's | 99.8% | $544,039 | $287 | 56 | 50.0% | 25.0% |
| 97405 | 129 | 43 | 38 | 2.8 | Balanced | 98.9% | $653,738 | $318 | 31 | 68.4% | 28.9% |
| 97408† | 39 | 11 | 13 | 2.6 | Balanced | 100.1% | $676,642 | $333 | 24 | 76.9% | 38.5% |
From September 2026, these figures come straight from our local MLS: single-family homes closed during the calendar month, with active and pending counts as of September 30. Earlier months used a trailing 30-day read, so small differences from the August table reflect the method, not the market. † 97403 (9 closings) and 97408 (13) are small samples.
Key takeaways
- Eugene held in Soft Seller's territory at 2.3 months of inventory, slightly looser than August's 2.2.
- Sales slowed to 147 homes from 154, pendings slipped to 150 from 181, and active inventory held near 396.
- The average home price rose to $583,800 and the median to $520,000, while price per square foot eased to $305. More larger homes sold; that is a mix shift, not a jump in value.
- Homes took longer to sell: 45 average days on market, up from 39, with 62.6% selling within 30 days.
- The typical home sold at 99.4% of asking, and about a third (32.7%) sold above it.
- 97401 and 97404 are Eugene's tightest ZIP codes (Healthy Seller's); 97405 and 97408 moved into Balanced territory.
- 97402 gave buyers the most time at 69 average days on market.
Selling a home
September still favors a well-priced Eugene house, but buyers are taking their time. Inventory held steady while closings and pendings both eased, and homes averaged 45 days on market. A house priced to this month's comparable sales and ready to show can still sell near full asking; one priced to test the market is more likely to sit into the holidays. In the tighter ZIP codes, 97401 and 97404, sellers keep a clear edge. In 97405 and 97408, expect buyers to compare more homes before they make an offer. If you want a street-level read before you list, ask us about our 1.95% Listing Advantage.
Buying a home
Fall gives Eugene buyers a little more room. With 45 average days on market and most homes selling just under asking, you can usually see a house twice and get an inspection scheduled before deciding. Competition is still real in 97401 and 97404, where supply is under two months, so arrive pre-approved there. West Eugene's 97402 and the south hills of 97405 offer the most choice right now. Start with current Eugene homes for sale.
What's My Home Worth in Eugene, Oregon?
If you're thinking about selling in Eugene, or simply want to know what your home could realistically sell for right now, our team can prepare a custom valuation based on what's selling on your street and in your ZIP code this month. As a local Eugene brokerage since 2003, we read this market every day, not from a national dashboard. Start with What's my home worth?, or Connect with us and one of our agents will follow up with a no-obligation valuation.
Show the previous 13 months
August 2026
The Eugene, Oregon housing market stayed in Soft Seller's territory in August 2026, at 2.2 months of inventory — a hair tighter than July's 2.3, but with a slower close pace and the first citywide slip below full asking since spring. Sellers closed 154 single-family homes over the trailing 30 days (down from July's 170), and the typical Eugene home sold at 98.9% of list (versus 100.0% in July).
Per the most recent Local Market Pulse report for single-family homes in Eugene, Oregon, the story this month is a thinner pending pipeline meeting a more deliberate buyer. Active listings were essentially flat at 391 (from 388), while homes under contract fell to 181 from 214. Homes that did sell took longer: average days on market stretched to 39 from 29, and 63.6% closed within 30 days (down from 73.5%).
Eugene home prices eased. The average sold price came in at $556,434 (versus $572,788 in July), while price per square foot slipped slightly to $313 from $316 — more a mix of what closed than a broad markdown. Fewer upper-end 97408 sales and a heavier mid-price close mix pulled the citywide average down even as several Eugene zip codes held their ground. Underneath the citywide numbers, competition concentrated: 97404 tightened into the clearest Healthy Seller's pocket in the city, while 97403 stayed the Balanced opening for buyers — with only 3 closings, too thin to quote a typical price.
By ZIP code
The citywide numbers tell one story; the ZIP-code breakdown tells another. The Eugene, Oregon housing market in August 2026 is not moving uniformly — buyers and sellers in different parts of the city are operating under meaningfully different conditions, and knowing which pocket you're in changes your strategy.
97404 (north Eugene, Santa Clara corridor) is August's tightest corner: 1.3 months of supply, 40 closings, and a Healthy Seller's Market. If you're buying there, expect competition on well-priced homes. If you're selling, pricing at market still produces near-full-ask results (99.8% list-to-sold). The Santa Clara neighborhood and surrounding north Eugene streets stayed the most active pocket of the city this month. Browse current Eugene homes for sale.
97403 (south Eugene, including the Fairmount and Southeast neighborhood) remains the clearest balanced pocket — 3.7 months of supply, only 6 homes under contract, and 3 closings. There is no reliable average sold price this month; the sample is too small. Buyers who have been priced out or outcompeted elsewhere in Eugene should look here first.
Citywide, the typical Eugene home sold a little under list for the first time since spring, and above-list deals fell to 26.6% from 36.5%. The softening shows up in pace and negotiating room, not in a collapse of demand. Active inventory barely moved.
For context on how Eugene's market compares to the broader region, the Lane County housing market report tracks conditions across the county, including the Springfield housing market update and surrounding communities. If you're weighing Eugene against nearby options, the Eugene vs. Portland real estate comparison is also worth a read.
Questions about what these numbers mean for your specific situation — whether you're buying, selling, or just tracking the Eugene housing market — Connect with us directly. We pull this data monthly from our local MLS so you're working from the same numbers your agent is.
| Eugene Zip | Active | Pending | Sold (30d) | Months Supply | Market | List vs. Sold | Avg Sold | $/Sq Ft | Avg DOM | % Sold <30 Days | % Above List |
|---|---|---|---|---|---|---|---|---|---|---|---|
| Eugene (All) | 391 | 181 | 154 | 2.2 | Soft Seller's | 98.9% | $556,434 | $313 | 39 | 63.6% | 26.6% |
| 97401 | 49 | 35 | 25 | 1.9 | Soft Seller's | 99.8% | $626,876 | $315 | 32 | 60.0% | 32.0% |
| 97402 | 90 | 46 | 35 | 2.3 | Soft Seller's | 99.0% | $465,849 | $290 | 66 | 54.3% | 25.7% |
| 97403† | 31 | 6 | 3 | 3.7 | Balanced | — | — | — | — | — | — |
| 97404 | 54 | 38 | 40 | 1.3 | Healthy Seller's | 99.8% | $493,517 | $298 | 30 | 70.0% | 32.5% |
| 97405 | 128 | 42 | 43 | 2.5 | Soft Seller's | 97.7% | $592,866 | $328 | 32 | 67.4% | 23.3% |
| 97408 | 39 | 14 | 9 | 2.4 | Soft Seller's | 96.4% | $751,111 | $385 | 29 | 55.6% | 0.0% |
97403 had only 3 closings this period — too thin to publish averages. Active inventory and the Balanced Market label still stand.
Key takeaways
- Eugene stayed in Soft Seller's territory at 2.2 months of inventory — slightly tighter than July's 2.3, but with a slower close pace.
- Sales fell to 154 homes from 170, pendings cooled to 181 from 214, and active inventory was essentially flat at 391.
- The typical Eugene home sold at 98.9% of list, the first citywide slip below full asking since spring (July was 100.0%).
- Average sold price eased to $556,434 from $572,788, with price per square foot slipping slightly to $313 — a mix of what closed, not a broad markdown.
- Homes took longer to sell: average days on market stretched to 39 from 29, and 63.6% closed within 30 days (down from 73.5%).
- 97404 is August's tightest Eugene zip at 1.3 months of supply (Healthy Seller's), with 40 closings and near-full-ask results.
- 97402 slowed the most on time: average days on market jumped to 66 from 33.
- 97403 is the clearest buyer opening: a Balanced Market at 3.7 months of supply with only 3 closings. Do not treat it as a price signal this month.
Selling a home
August still favors well-priced Eugene sellers, but the cushion is thinner than it was in July. Active inventory barely moved, yet fewer buyers are in contract, days on market stretched, and the typical home sold a little under list. Homes priced to today's comps can still close; listings that test the market will sit. The 181 homes currently pending still point to a workable closing pipeline into fall, but it is lighter than July's 214, and automatic month-over-month price gains remain off the table. If you want a street-level read before you list, ask us about our 1.95% Listing Advantage.
Buying a home
Competition hasn't vanished — it has concentrated. 97404 still rewards pre-approval and quick decisions: 1.3 months of supply and 40 closings is the tightest read in the city. If you want negotiating room, 97403 is the opening this month: Balanced conditions, a thin sales sample, and more homes sitting than moving. Across the rest of Eugene, the cooler pending count, longer days on market, and 98.9% list-to-sold mean you can be more deliberate than you could in mid-summer. Start with current Eugene homes for sale.
July 2026
Eugene's housing market eased a notch in July 2026. After June's firm Healthy Seller's read, the city settled back into a Soft Seller's Market at 2.3 months of inventory — still seller-leaning, but with more selection and a thinner pending pipeline. Sellers closed 170 homes over the trailing 30 days (essentially flat with June's 169), and the typical home still sold at full asking (a 100.0% list-to-sold ratio).
Per the most recent Local Market Pulse report for single-family homes in Eugene, Oregon, the story this month is a wider shelf of choices meeting a slightly more deliberate buyer. Active listings climbed about 6% to 388, while homes under contract slipped to 214 from 239. That combination kept months of supply in Soft Seller's territory even as well-priced homes continued to move quickly: average days on market improved to 29 (from 33), and 73.5% of sales still closed within 30 days.
Price held steady. The average sold price was essentially unchanged at $572,788 (versus $573,477 in June), while price per square foot eased slightly to $316 from $320 — more a mix of what sold than a broad soft patch. Nationwide, summer cooled as expected and mortgage rates drifted higher again as cost-of-living pressure and broader uncertainty weighed on affordability; locally, that shows up as buyers taking a beat, not as a collapse in demand. Underneath the citywide numbers, competition rotated once more: 97404 remained the tightest corner of Eugene, while 97403 opened into the clearest Balanced pocket for buyers.
By ZIP code
The citywide numbers tell one story; the ZIP-code breakdown tells another. Eugene's market in July 2026 is not moving uniformly — buyers and sellers in different parts of the city are operating under meaningfully different conditions, and knowing which pocket you're in changes your strategy.
97404 (north Eugene, Santa Clara corridor) remained the tightest corner of the market this month, with the lowest months of supply and the fastest absorption. If you're buying there, expect competition on well-priced homes. If you're selling, pricing at market still produces full-ask results. The Santa Clara neighborhood and surrounding north Eugene streets have been consistently active all summer.
97403 (south Eugene, including the Fairmount and Southeast neighborhoods) opened into the clearest balanced pocket for buyers this month — more selection, slightly longer days on market, and a bit more room to negotiate. Buyers who have been priced out or outcompeted elsewhere in Eugene should look here first. Browse current listings in Fairmount and the Southeast neighborhood to get a feel for what's available.
Citywide, the average sold price held essentially flat month-over-month, and the list-to-sold ratio stayed at 100% — meaning well-priced homes are still moving at asking. The softening shows up in inventory and pending counts, not in price capitulation. That's an important distinction for sellers deciding whether now is the right time to list.
For context on how Eugene's market compares to the broader region, the Lane County housing market report tracks conditions across the county, including Springfield and surrounding communities. If you're weighing Eugene against nearby options, the Eugene vs. Portland real estate comparison is also worth a read.
Questions about what these numbers mean for your specific situation — whether you're buying, selling, or just tracking the market — reach out to the Heart & Home team directly. We pull this data monthly from our local MLS so you're working from the same numbers your agent is.
| Eugene Zip | Active | Pending | Sold (30d) | Months Supply | Market | List vs. Sold | Avg Sold | $/Sq Ft | Avg DOM | % Sold <30 Days | % Above List |
|---|---|---|---|---|---|---|---|---|---|---|---|
| Eugene (All) | 388 | 214 | 170 | 2.3 | Soft Seller's | 100.0% | $572,788 | $316 | 29 | 73.5% | 36.5% |
| 97401 | 50 | 32 | 27 | 2.0 | Healthy Seller's | 100.0% | $614,437 | $342 | 23 | 77.8% | 33.3% |
| 97402 | 92 | 55 | 37 | 2.5 | Soft Seller's | 100.0% | $443,755 | $313 | 33 | 75.7% | 29.7% |
| 97403† | 27 | 11 | 4 | 3.2 | Balanced | 99.9% | $998,000 | $334 | 73 | 25.0% | 25.0% |
| 97404 | 65 | 52 | 34 | 1.9 | Healthy Seller's | 99.4% | $481,382 | $294 | 34 | 67.6% | 44.1% |
| 97405 | 123 | 51 | 49 | 2.4 | Soft Seller's | 100.0% | $588,861 | $316 | 23 | 79.6% | 44.9% |
| 97408 | 31 | 14 | 20 | 2.0 | Healthy Seller's | 99.3% | $793,073 | $331 | 30 | 65.0% | 20.0% |
97403 reflects a limited 4-sale sample for the period — its averages should be read with caution. The high average sold price is driven by a couple of upper-end closings, not a broad zip-wide price jump.
Key takeaways
- Eugene eased from a Healthy Seller's Market back into Soft Seller's territory at 2.3 months of inventory — still seller-leaning, with more choice for buyers than in June.
- Sales held nearly flat at 170 homes (versus 169), while active inventory rose about 6% to 388 and pendings cooled to 214 from 239.
- The typical home still closed at exactly full asking (100.0% list-to-sold), so accurate pricing continues to win.
- Average sold price was essentially unchanged at $572,788, with price per square foot easing slightly to $316 — steady values, not a broad decline.
- Homes that sold moved a bit faster: average days on market improved to 29 from 33, and 73.5% closed within 30 days.
- 97404 remains July's tightest zip at 1.9 months of supply (Healthy Seller's), though it eased off June's Strong Seller's read at 1.7.
- 97405 posted the strongest close-speed among larger zips — 79.6% of homes sold within 30 days at an average of just 23 days on market.
- 97403 is the clearest buyer opening: a Balanced Market at 3.2 months of supply with only 4 closings. Treat its $998,000 average sold price as a thin-sample, upper-end mix effect.
Selling a home
July still favors well-priced sellers, but the margin for guessing high is thinner than it was in June. Active inventory is up, fewer buyers are in contract, and the Soft Seller's label is a reminder that selection — plus rates and everyday cost-of-living pressure — is making shoppers more selective. Homes priced to today's comps are still selling in about a month and at full list; listings that test the market will sit. The 214 homes currently pending still point to a workable closing pipeline through August, but automatic month-over-month price gains remain off the table.
Buying a home
Competition hasn't vanished — it has narrowed. 97404 and the faster corners of 97405 and 97401 still reward pre-approval and quick decisions. If you want negotiating room, 97403 is the clearest opening this month: Balanced conditions, a thin sales sample, and longer days on market give more space on price and terms. Across the rest of Eugene, the wider active inventory and cooler pending count mean you can be more deliberate than you could earlier this spring, especially while rates and affordability keep many buyers careful.
June 2026
Eugene's housing market firmed up in June 2026. After easing into Soft Seller's territory in May, the market tightened back into a Healthy Seller's Market at 2.3 months of inventory — and it did so the healthy way, by clearing homes faster rather than by running short on supply. Sellers moved 169 homes over the trailing 30 days, up sharply from 146, while the typical home still closed at exactly full asking (a 100.0% list-to-sold ratio).
Per the most recent Local Market Pulse report for single-family homes in Eugene, Oregon, the story this month is absorption catching up to inventory. Active listings kept climbing — up about 9% to 366 — but buyers absorbed them at a faster clip, which is why months of supply fell even as raw inventory grew. Average days on market held steady at 33, and roughly three in four homes (74.6%) still closed within 30 days.
Price held its ground. The average sold price was essentially flat at $573,477 (versus $571,848 in May), while price per square foot rose about 3% to $320 — a sign that value is steady and that last month's dip was a composition effect, not a decline. Underneath the citywide numbers, competition rotated again: 97404 emerged as the tightest corner of the city, while 97403 remained the clearest buyer opening.
Market trends
| Eugene Zip | Active | Pending | Sold (30d) | Months Supply | Market | List vs. Sold | Avg Sold | $/Sq Ft | Avg DOM | % Sold <30 Days | % Above List |
|---|---|---|---|---|---|---|---|---|---|---|---|
| Eugene (All) | 366 | 239 | 169 | 2.3 | Healthy Seller's | 100.0% | $573,477 | $320 | 33 | 74.6% | 34.3% |
| 97401 | 52 | 32 | 20 | 2.5 | Healthy Seller's | 100.0% | $547,410 | $343 | 15 | 90.0% | 45.0% |
| 97402 | 90 | 57 | 35 | 2.4 | Healthy Seller's | 99.7% | $419,655 | $316 | 42 | 65.7% | 22.9% |
| 97403 | 24 | 9 | 11 | 2.5 | Soft Seller's | 97.1% | $751,696 | $370 | 72 | 72.7% | 36.4% |
| 97404 | 56 | 57 | 39 | 1.7 | Strong Seller's | 99.2% | $483,784 | $301 | 24 | 71.8% | 35.9% |
| 97405 | 111 | 65 | 50 | 2.4 | Healthy Seller's | 100.0% | $651,088 | $316 | 32 | 78.0% | 34.0% |
| 97408 | 33 | 20 | 14 | 3.0 | Soft Seller's | 99.7% | $827,921 | $331 | 32 | 71.4% | 42.9% |
Key takeaways
- Eugene firmed back into a Healthy Seller's Market at 2.3 months of inventory (down from 2.4) — a reversal of last month's softening, driven by faster absorption rather than tighter supply.
- Sales climbed to 169 homes from 146 (+16%), even as active inventory grew about 9% to 366 — buyers kept pace with the added selection.
- The typical home closed at exactly full asking (100.0% list-to-sold), holding the pattern of well-priced homes selling at list.
- Average sold price was essentially flat at $573,477, while price per square foot rose about 3% to $320 — steady value, confirming May's dip was a mix effect.
- Homes kept moving quickly: 74.6% closed within 30 days, and average days on market held at 33.
- 97404 is June's tightest zip — a Strong Seller's Market at 1.7 months of supply, with more homes under contract (57) than actively listed (56).
- 97401 was the fastest-moving zip at just 15 average days on market, with 90% of homes selling inside 30 days.
- 97403 remains the clearest negotiating room in Eugene — the lowest list-to-sold ratio (97.1%) and longest days on market (72). Its high average sold price this month reflects a handful of upper-end closings, not a broad price jump.
Selling a home
June was a constructive month for sellers. The market absorbed a growing supply of listings without giving up price — the average held, price per square foot ticked up, and the typical home still closed at full list. That said, the underlying message hasn't changed: this is a market that rewards accurate pricing, not aggressive pricing. With 366 homes active and buyers now choosing from a wider field, correctly priced homes are still selling in about a month, while overpriced listings will sit and accumulate days on market. The 239 homes currently pending point to a solid closing pipeline through July, but the era of automatic month-over-month price gains has clearly paused.
Buying a home
Competition in Eugene is rotating, not disappearing. This month the pressure concentrated in 97404, where homes under contract outnumbered active listings and supply fell to just 1.7 months — if you're shopping there, come pre-approved and ready to move. For buyers seeking leverage, 97403 continues to offer the most room: it carries the lowest list-to-sold ratio in the city and the longest average days on market, which means more space to negotiate on price and terms. Across the rest of Eugene, the wider selection lets buyers be more deliberate than they could earlier this spring, even as well-priced homes still move fast.
May 2026
Eugene's housing market sent a readable, two-sided signal in May 2026: the typical home still sold at full asking — a 100.5% list-to-sold ratio — yet the broader market eased a notch, slipping from a Healthy Seller's Market into Soft Seller's territory at 2.4 months of inventory. With 337 active listings, 241 homes under contract, and 146 closings over the trailing 30 days, supply is building faster than it's clearing, even as well-priced homes keep moving quickly.
Per the most recent Local Market Pulse report for single-family homes in Eugene, Oregon, the real tension this month is between speed and selection. Homes priced correctly are selling faster than they were in April — 75.3% closed within 30 days, up from 66.9% — and average days on market dropped from 46 to 33. At the same time, active inventory grew about 9% and the average sold price eased roughly 4%, from $595,813 to $571,848.
That price dip looks driven more by which homes sold than by any broad decline in value. Nearly a quarter of May's closings came out of 97402, Eugene's most affordable zip at a $418,172 average — enough lower-priced volume to pull the citywide average down without signaling that home values are falling. Competition, meanwhile, has migrated: 97405 has emerged as the city's hottest zip, while 97403 has softened into the clearest buyer opening in Eugene.
Market trends
| Eugene Zip | Active | Pending | Sold (30d) | Months Supply | Market | List vs. Sold | Avg Sold | $/Sq Ft | Avg DOM | % Sold <30 Days | % Above List |
|---|---|---|---|---|---|---|---|---|---|---|---|
| Eugene (All) | 337 | 241 | 146 | 2.4 | Soft Seller's | 100.5% | $571,848 | $310 | 33 | 75.3% | 35.6% |
| 97401 | 47 | 31 | 24 | 2.7 | Soft Seller's | 99.5% | $641,267 | $308 | 21 | 75.0% | 20.8% |
| 97402 | 76 | 66 | 36 | 2.2 | Healthy Seller's | 100.1% | $418,172 | $301 | 48 | 58.3% | 33.3% |
| 97403 | 22 | 14 | 9 | 3.1 | Soft Seller's | 103.0% | $553,900 | $267 | 59 | 66.7% | 22.2% |
| 97404 | 64 | 49 | 30 | 2.2 | Healthy Seller's | 100.2% | $478,579 | $306 | 24 | 86.7% | 36.7% |
| 97405 | 102 | 66 | 40 | 2.5 | Soft Seller's | 102.0% | $682,045 | $329 | 17 | 90.0% | 55.0% |
| 97408† | 26 | 15 | 7 | 2.6 | Soft Seller's | 94.9% | $917,286 | $328 | 95 | 42.9% | 0.0% |
97408 reflects a limited 7-sale sample for the period — its averages should be read with caution, not as a firm trend.
Key takeaways
- The average list-to-sold ratio held at 100.5%, up slightly from 100.0% in April — the typical Eugene home is still selling at full asking.
- The market eased from a Healthy Seller's Market to a Soft Seller's Market at 2.4 months of inventory (up from 2.3) — the first softening in the classification this spring.
- Active inventory rose to 337 from 309 (+9%), and 241 homes under contract point to a strong closing pipeline through June.
- Average sold price eased about 4% to $571,848 — largely a mix effect from heavier affordable-zip volume, not a broad decline in home values.
- Homes sold faster: 75.3% closed within 30 days (up from 66.9%), and average days on market fell from 46 to 33.
- 97405 is May's most competitive zip — 90.0% of homes sold within 30 days, at an average of just 17 days on market.
- 97403 is the softest Eugene zip at 3.1 months of inventory — the clearest negotiating room in the city right now.
- Above-list activity held near 35.6% citywide — though many of these are full-price deals where buyers nudged offers up to cover seller-paid closing costs, not open bidding wars.
Selling a home
The headline is encouraging: the typical well-priced Eugene home is still closing at full list. But the market has shifted from frenzied to firm. With active inventory up 9% and the classification easing into Soft Seller's territory, buyers have more choices than they did 60 days ago — which means accurate pricing matters more than it has all spring. Homes priced right are still selling fast (75.3% within 30 days), but the runway for testing an aggressive number has shortened, and mispriced listings will sit. The 241 homes currently pending suggest closings stay strong through June, but the easy month-over-month gains in average price have paused.
Buying a home
Competition hasn't eased so much as it has rotated. 97405 and 97404 now demand the preparation that the tightest zips required earlier this spring — pre-approval in hand, decisive showings, and an agent actively watching new listings. If you're looking for an opening, 97403 is it: at 3.1 months of inventory and the lowest above-list share among Eugene's active zips, there's negotiating room that simply doesn't exist in 97404 or 97405 right now. The wider selection across the city also means buyers can afford to be more deliberate than they could in March.
April 2026
Eugene's housing market crossed a notable threshold in April 2026: the average list-to-sold price ratio reached 100.0%, meaning sellers are now collecting full asking price on the typical home. With 309 active listings, 209 under contract, and 148 closings over the trailing 30 days, the spring acceleration we tracked earlier this year has settled into a steadier, broader pattern of seller-side strength.
Per the most recent Local Market Pulse report for single-family homes in Eugene, Oregon, Eugene remains in a Healthy Seller's Market at 2.3 months of inventory — tighter than March's 2.6 even as active inventory grew by nearly 50 homes. More homes are coming on, and the market is absorbing them faster than they're arriving.
The story this month is less about acceleration and more about where competition has migrated. 97405 has emerged as the hottest zip code in Eugene — 76.6% of homes sold within 30 days, 44.7% closed above list, and a 100.7% list-to-sold ratio. 97404 remains strong on absorption but is normalizing on speed. Meanwhile, 97403 has softened into Soft Seller's Market territory at 3.4 months of inventory — the only Eugene zip not in Healthy Seller's range. 97408 had only 7 closings this period — too thin a sample to draw firm conclusions on price or speed, though inventory and pending activity remain healthy.
Market trends
| EugeneZip Codes | Inventory Month Supply | List vs. Sold Price | Homes Sold 0–30 Days on Market | Avg Sold Price | Sold Price per Sq Foot | Average Days on Market | Available Homes for Sale |
|---|---|---|---|---|---|---|---|
| Eugene | 2.3 | 100.0% | 66.9% | $595,813 | $310 | 46 | 309 |
| 97401 | 2.1 | 99.0% | 64.3% | $840,862 | $313 | 73 | 35 |
| 97402 | 2.1 | 99.2% | 54.1% | $433,218 | $307 | 53 | 72 |
| 97403 | 3.4 | 102.1% | 50.0% | $663,910 | $280 | 78 | 23 |
| 97404 | 1.8 | 100.1% | 69.7% | $499,600 | $306 | 40 | 54 |
| 97405 | 2.6 | 100.7% | 76.6% | $677,026 | $315 | 36 | 102 |
| 97408 | 2.2 | 98.6% | 85.7% | $776,160 | $346 | 14 | 23 |
Key takeaways
- Average list-to-sold price ratio reached 100.0%, up from 99.3% in March — sellers are now collecting full asking on the typical home.
- Active inventory grew to 309, up from 260 (+19%), yet months of inventory tightened to 2.3 — supply is being absorbed faster than it's arriving.
- Average sold price held at $595,813, essentially flat versus March's $598,399 — the spring price climb has paused while volume widened.
- 35.8% of homes sold above list, modestly up from 34.7% — above-list activity is now the norm in more than 1-in-3 sales.
- 97405 is May's most competitive zip — 76.6% of homes sold within 30 days and 44.7% closed above list.
- 97404 still leads on absorption at 1.8 months of inventory, but average days on market rose from 18 to 40 — early-spring frenzy has moderated.
- 97403 cooled into Soft Seller's Market territory at 3.4 months of inventory — the only Eugene zip not in Healthy Seller's range.
- 209 homes currently under contract feed a strong closing pipeline into June.
Selling a home
By May, the spring acceleration we tracked earlier this year has shifted into something more durable: a market where the typical well-priced home now closes at full list. That's a meaningful threshold. For sellers, accurate pricing is being rewarded clearly — and modest over-pricing no longer carries the runway it did in late winter. Buyer pools have more choices than they did 60 days ago, so days on market for mispriced homes will stretch. The 209 homes currently pending suggest closings will stay strong through early summer, but the easy gains in average sold price have flattened.
Buying a home
Competition hasn't eased — it has rotated. 97405 and 97404 now require the preparation that 97404 and 97408 demanded two months ago: pre-approval in hand, decisive showings, and an agent watching new listings actively. If you're looking for an opening, 97403 is it — three-plus months of inventory and a meaningful share of homes selling below list mean there's negotiating room that doesn't exist elsewhere in Eugene right now.
March 2026
The Eugene, Oregon real estate market accelerated sharply in March 2026. Average home prices climbed nearly $50,000 from February, days on market dropped to 44, and 65% of homes sold within 30 days — a clear signal that spring buyer demand arrived early and strong. If the February data showed the market warming up, March confirms it has arrived.
Per the most recent Local Market Pulse report for single-family homes in Eugene, Oregon, Eugene remains in a Healthy Seller's Market with 2.6 months of inventory — with 260 homes currently available and 211 under contract, the pipeline heading into April is among the strongest we've seen this cycle.
The headline number this month is the list-to-sold price ratio: 99.3%. That means buyers are paying almost exactly what sellers are asking — and in competitive zip codes like 97404, the average is already above list at 101.0%. The Eugene housing market is rewarding well-priced homes quickly.
Market trends
| EugeneZip Codes | Inventory Month Supply | List vs. Sold Price | Homes Sold 0–30 Days on Market | Avg Sold Price | Sold Price per Sq Foot | Average Days on Market | Available Homes for Sale |
|---|---|---|---|---|---|---|---|
| Eugene | 2.6 | 99.3% | 65.3% | $598,399 | $316 | 44 | 260 |
| 97401 | 3.3 | 98.5% | 60.0% | $743,127 | $298 | 63 | 33 |
| 97402 | 2.7 | 99.0% | 56.5% | $382,904 | $311 | 42 | 62 |
| 97403 | 4.0 | 103.9% | 60.0% | $776,800 | $355 | 32 | 20 |
| 97404 | 2.2 | 101.0% | 84.2% | $505,579 | $277 | 18 | 41 |
| 97405 | 2.5 | 98.6% | 64.5% | $682,869 | $336 | 46 | 79 |
| 97408 | 1.9 | 97.9% | 61.5% | $733,945 | $332 | 72 | 25 |
Key takeaways
- Average sold price reached $598,399 — up nearly $50,000 from February's $549,021.
- Average days on market dropped to 44, down from 72 in February — homes are moving significantly faster.
- 65.3% of Eugene homes sold within 30 days, up from 44.6% — spring urgency is driving faster decisions.
- List-to-sold ratio improved to 99.3%, up from 96.2% — sellers are getting closer to full asking price.
- 34.7% of homes sold above list price, nearly double February's 18.8%.
- 97404 is the most competitive zip code — 84.2% of homes sold within 30 days at 101% of list price.
- 97408 entered Strong Seller's Market territory with just 1.9 months of inventory.
- 211 homes currently under contract signal continued momentum heading into April.
Selling a home
March data reinforces that spring 2026 is a strong window to sell. Prices are up, homes are moving fast, and buyers are competing — 34.7% of sales went above list price. If your home is priced correctly and presented well, you can expect serious interest quickly. The gap between list and sold price has nearly closed, which means underpricing leaves money on the table and overpricing still carries risk in a market where buyers have more choices than last fall.
Buying a home
Competition has returned. With 65% of homes selling within 30 days and multiple zip codes averaging at or above list price, buyers who wait or move slowly are losing homes. The best-positioned buyers in this market are pre-approved, decisive, and working with an agent who knows which neighborhoods are moving fastest. 97404 and 97408 in particular require quick action — homes there are gone fast.
February 2026
The Eugene, Oregon real estate market is showing clear signs of strengthening as we head into spring 2026. With inventory tightening, homes selling faster, and buyers closing the gap between list and sold prices, the Eugene housing market is trending more competitive—especially for well-priced, move-in-ready homes in desirable neighborhoods.
Per the most recent Local Market Pulse report for single-family homes in Eugene, Oregon, Eugene is currently in a Healthy Seller’s Market with 2.32 months of inventory (MOI). That’s a meaningful drop from the prior period (3.34 → 2.32), and it’s one of the strongest indicators that demand is picking up.
Here’s what stands out in the latest data:
The Eugene market is picking up as we move into spring 2026—a classic seasonal pattern, but with a noticeable tightening in inventory that can amplify competition.
- MOI fell from 3.34 to 2.32, tightening supply and reinforcing seller-friendly conditions.
- List-to-sold price improved from 94.8% to 96.2%, meaning buyers are paying closer to asking price.
- Average sold price rose from $533,044 to $549,021, reflecting upward pressure on average home prices in Eugene.
- Average days on market dropped from 91 to 72, signaling faster buyer decision-making.
- Inventory decreased from 254 to 234 homes, reducing buyer choice and adding competition to the best listings.
Key Market Insights
Market Type: Eugene has 2.32 months of inventory, which corresponds to a Healthy Seller’s Market, with 234 homes currently available for sale based on the selected criteria.
Future Market Trends: The report’s projected direction shows signs the Eugene housing market may be moving into a Strong Seller’s Market, with 163 homes currently in contract, indicating active buyer demand heading into spring.
Offer Strength: In the last 30 days, 18.8% of homes sold above list price, showing moderate competition. Homes that went under contract in the first week averaged 100.6% of list price, while homes that took 8–30 days averaged 100.7%—both very close to (and slightly above) list, which signals that properly priced homes are still commanding strong offers early. Overall, the market averaged 96.2% list-to-sold, with 101 homes sold and an average sold price of $549,021.
Market Speed: Eugene’s pace is moderate but improving, with 28.7% of sold homes going under contract in 0–7 days. Combined, 44.6% of sold homes were on the market less than 30 days (0–7 plus 8–30 days), while the overall average days on market is 72.
Buyer Strength: Buyer strength looks healthy: 65.3% of purchases were conventional, which typically signals well-qualified buyers. Cash buyers made up 22.8%, a notable share that adds competitive pressure, especially on desirable homes. FHA and VA activity is present but smaller, pointing to a market still led by conventional and cash strength.
What This Means for the Housing Market
Eugene is tightening up. When MOI drops into the low-2s and inventory shrinks at the same time, buyers tend to feel urgency around the best homes—especially those that are turnkey and priced correctly. Sellers benefit from improved demand and stronger pricing outcomes, while buyers often win by acting early, staying prepared, and focusing on homes that are positioned well from day one.
Final Thoughts on the Real Estate Market
The Eugene, Oregon real estate market is gaining speed as we head into spring 2026. With higher average home prices, faster market times, and improving list-to-sold performance, Eugene remains seller-friendly—and the trend line suggests it may continue tightening if buyer demand stays consistent through the spring season.
Market trends
| Eugene Zip Codes | Inventory Month Supply | List vs. Sold Price | Homes Sold 0-30 Days on Market | Avg Sold Price | Sold Price perSq Foot | Average Days on Market | Available Homes for Sale |
|---|---|---|---|---|---|---|---|
| Eugene | 2.32 | 96.2% | 44.6% | $549,021 | $298 | 72 | 234 |
| 97401 | 1.70 | 93.7% | 30.0% | $650,800 | $305 | 93 | 34 |
| 97402 | 2.86 | 98.4% | 50.0% | $392,457 | $283 | 57 | 63 |
| 97403 | 4.00 | 98.7% | 25.0% | $830,125 | $373 | 75 | 16 |
| 97404 | 1.59 | 96.6% | 45.5% | $489,488 | $275 | 75 | 35 |
| 97405 | 2.15 | 96.3% | 44.4% | $583,885 | $296 | 71 | 58 |
| 97408 | 5.00 | 96.0% | 83.3% | $657,829 | $338 | 48 | 30 |
January 2026
The Eugene real estate market experienced a noticeable shift in January, driven by rising inventory levels and longer days on market. While Eugene remains firmly in a Healthy Sellers Market, the data shows clear signs of changing buyer behavior—particularly when it comes to older or overpriced homes. This evolving dynamic is important for both buyers and sellers navigating the Eugene, Oregon housing market.
Inventory supply increased significantly month over month, rising from 1.93 months to 3.34 months of inventory (MOI). This jump places Eugene in a healthier, more balanced seller-favorable position compared to the tight conditions seen late last year. Total available homes on the market climbed from 234 to 254 active listings, giving buyers more choices and leverage, especially on homes that have been sitting longer.
At the same time, sales activity reveals that 63.2% of homes sold in January were on the market for 30 days or longer. This strongly suggests that aged inventory played a major role in overall sales volume, with sellers often adjusting prices to meet buyer expectations. Buyers, in turn, were more willing to negotiate, reinforcing a market where pricing strategy matters more than ever.
Average days on market increased sharply from 58 days to 91 days, further confirming that homes requiring updates or priced above market value are taking longer to sell. Move-in-ready and well-priced homes still attract attention, but the broader Eugene housing market is rewarding patience and flexibility rather than urgency.
Market Type
Eugene is currently in a Healthy Sellers Market with 3.34 months of inventory and 254 homes actively available. This level of supply favors sellers overall, but no longer reflects an aggressive or fast-moving environment across the board.
Future Market Trends
The market is showing signs of remaining in a Healthy Sellers Market, supported by 125 homes currently pending. However, rising inventory and longer market times suggest conditions may continue to soften slightly if supply continues to grow.
Offer Strength
In the past 30 days, 13.2% of homes sold above list price, indicating selective competition rather than widespread bidding wars. Homes that went under contract within the first 7 days achieved an average 99.9% list-to-sold price ratio, compared to an overall average of 94.8%, highlighting how critical early momentum is. Properties taking 8–30 days or longer saw noticeably lower list-to-sold ratios, reinforcing the pricing advantage of attracting offers in the first week.
Market Speed
Only 22.4% of homes sold in the last 30 days were on the market for 7 days or less, while 63.2% sold after 30+ days, confirming a slower overall pace. Combined, just 36.8% of sold homes were on the market less than 30 days, with an average days on market of 91 days, signaling that patience is often required for successful sales.
Buyer Strength
Buyer demand remains healthy and stable, led by conventional financing at 68.4% of purchases. Cash buyers accounted for 22.4%, which is notable and signals continued confidence among well-capitalized buyers. FHA and VA loans made up a smaller share, indicating this market still favors financially strong, well-qualified buyers.
Final Thoughts on the Real Estate Market
The Eugene, Oregon housing market is no longer defined by urgency alone. Instead, it has entered a more strategic phase where pricing accuracy, home condition, and timing matter greatly. Sellers with updated, well-located homes can still achieve strong outcomes, while those with older or less competitive listings should be prepared for negotiations and longer timelines.
For buyers, this market offers increasing opportunity—especially when targeting homes that have been on the market longer and may be primed for price adjustments. As inventory continues to rise, Eugene is shaping up to be a market where informed decisions and local expertise make a meaningful difference.
Market trends
| Eugene Zip Codes | Inventory Month Supply | List vs. Sold Price | Homes Sold 0-30 Days on Market | Avg Sold Price | Sold Price perSq Foot | Average Days on Market | Available Homes for Sale |
|---|---|---|---|---|---|---|---|
| Eugene | 3.34 | 94.8% | 36.8% | $533,044 | $295 | 91 | 254 |
| 97401 | 2.36 | 91.8% | 57.1% | $588,857 | $279 | 134 | 33 |
| 97402 | 3.77 | 93.1% | 27.3% | $403,725 | $270 | 78 | 83 |
| 97403 | 3.17 | 102.5% | 33.3% | $700,000 | $344 | 77 | 19 |
| 97404 | 2.57 | 95.2% | 28.6% | $479,464 | $270 | 109 | 36 |
| 97405 | 3.93 | 94.9% | 40.0% | $626,000 | $328 | 68 | 59 |
| 97408 | 4.17 | 96.0% | 33.3% | $647,148 | $340 | 59 | 25 |
Year-end 2025
The Eugene, Oregon real estate market entered 2026 with clear seasonal shifts but continued underlying strength. Based on the most recent Local Market Pulse data, months of inventory (MOI) declined from 2.66 to 1.93, driven largely by seasonal holiday withdrawals rather than a surge in buyer demand. Available inventory dropped from 309 homes to 234 active listings, tightening choices for buyers while still allowing room for negotiation.
With 1.93 months of inventory, Eugene is currently categorized as a Strong Sellers Market, though buyer behavior reflects a more balanced dynamic. Homes are taking longer to secure contracts, with an average of 58 days on market, and pricing has softened modestly. The average sold price decreased from $537,508 to $513,687, while the average price per square foot declined from $290 to $277, signaling more realistic seller expectations in the Eugene housing market.
Despite reduced inventory, buyers retain negotiating leverage. The overall list-to-sold price ratio sits at 95.4%, and more than half of sold homes spent over 30 days on the market, reinforcing that pricing accuracy and presentation remain critical for sellers.
Key Market Insights – Housing Market
Market Type
Eugene is currently in a Strong Sellers Market with 1.93 months of inventory and 234 total homes available for sale across the market.
Future Market Trends
Market data points toward a Healthy Sellers Market, with 95 homes currently pending. The Eugene real estate market shows signs it may remain seller-favored while continuing to normalize compared to prior years.
Offer Strength
In the last 30 days, 23.1% of homes sold above list price, with properties that went under contract within 0–7 days achieving 101.8% of list price. Overall, homes sold at 95.4% of list price, showing a noticeable decline in price strength after the first week. Homes taking longer than 30 days to sell experienced deeper discounts, underscoring the importance of strong initial pricing and early buyer interest.
Market Speed
Approximately 21.5% of homes sold within the first 7 days, and 47.1% sold within 30 days, meaning nearly half of all sales moved relatively quickly. However, the overall average days on market is 58, reflecting a moderate market pace with more time for buyer decision-making.
Buyer Strength
Buyer strength in Eugene remains healthy, led by conventional financing at 59.5%, with cash buyers making up 21.5% of purchases—an important indicator of market stability. FHA and VA loans together account for a smaller share, suggesting balanced affordability without heavy distress-driven demand.
What We Forecast for 2026 in the Real Estate Market
Looking ahead, expectations for the Eugene housing market in 2026 remain optimistic and grounded. Mortgage rates are projected to stay below 6.5% throughout the year, with potential movement into the high 5% range, improving affordability and buyer confidence.
Even after ending 2025 with seasonally low inventory, overall housing supply remains at its highest levels in over five years, helping prevent extreme price spikes. Sellers are now entering their third consecutive year of more realistic pricing expectations, recognizing that premium pricing no longer guarantees multiple offers.
These combined factors point toward a healthy, sustainable real estate market—one that supports motivated buyers without eroding long-term home values and allows sellers to succeed when homes are priced and prepared correctly.
Final Thoughts on the Housing Market
The Eugene real estate market continues to mature into a more balanced environment. While technically still favoring sellers, the data clearly shows buyers have regained leverage through negotiation, longer days on market, and selective demand. For both buyers and sellers, strategy matters more now than at any point in recent years.
Market trends
| Eugene Zip Codes | Inventory Month Supply | List vs. Sold Price | Homes Sold 0-30 Days on Market | Avg Sold Price | Sold Price perSq Foot | Average Days on Market | Available Homes for Sale |
|---|---|---|---|---|---|---|---|
| Eugene | 1.93 | 95.4% | 47.1% | $513,687 | $277 | 58 | 234 |
| 97401 | 1.72 | 96.0% | 55.6% | $537,495 | $293 | 40 | 31 |
| 97402 | 2.82 | 98.8% | 71.4% | $444,963 | $277 | 34 | 79 |
| 97403 | 3.40 | 93.8% | 40.0% | $493,680 | $314 | 72 | 17 |
| 97404 | 1.27 | 95.4% | 36.7% | $462,867 | $268 | 80 | 38 |
| 97405 | 1.62 | 92.7% | 32.4% | $572,056 | $263 | 65 | 55 |
| 97408 | 2.14 | 96.6% | 42.9% | $676,143 | $331 | 94 | 15 |
November 2025
Market overview
As we step into the final month of the year, the Eugene, Oregon housing market is showing signs of its typical seasonal transition, while still maintaining solid momentum for sellers. According to the latest market report, Eugene remains in a Healthy Sellers Market, with 309 active listings, 134 homes currently in contract, and 116 homes sold in the past 30 days.
Despite the seasonal slowdown that’s common in December, this month’s data highlights a few important shifts. Days on market increased from 47 to 54 days, giving buyers a bit more time and breathing room compared to previous months. This uptick reflects a more measured pace as the holidays approach, and signals that homes may take slightly longer to sell unless they're priced competitively and in desirable condition.
Interestingly, while total inventory dropped from 341 to 309 homes, the months of inventory (MOI) rose from 2.16 to 2.66, suggesting that active listings are staying on the market just long enough to build a bit more supply. Still, this level of inventory keeps Eugene solidly within a sellers market.
Not all areas of Eugene are reacting the same way. For instance, homes located near the University of Oregon (zip code 97403) remain strong performers. While many neighborhoods across Eugene saw increased negotiation on price, homes near the university held firm with an impressive 99.4% list-to-sold price ratio, indicating that buyers continue to see strong value in that centrally located, high-demand area.
Key Market Insights: What’s Happening in the Housing Market?
Market Type: Healthy Sellers Market
With 2.66 months of inventory and only 309 homes currently listed, the Eugene real estate market is still tilted in favor of sellers. This level of inventory means competition remains moderate, and homes that are priced right are likely to attract serious buyer interest, especially those in well-located or move-in-ready condition.
Future Market Trends: Signs Point to Ongoing Seller Advantage
Looking ahead, current trends suggest that Eugene’s housing market is likely to stay in a Healthy Sellers Market. With 134 homes under contract, buyer demand is holding strong—even as we enter the slower winter season. This is a positive indicator for homeowners considering listing in early 2026.
Offer Strength: Early Offers Still Winning
Homes that went under contract in the first 7 days on the market received 102.9% of their asking price, on average. In contrast, homes that lingered for 8–30 days averaged 98.5%, and the overall list-to-sold ratio for all homes was 95.0%. This illustrates a key trend in the Eugene real estate market: the quicker a home goes pending, the closer it sells to its original list price. Well-priced homes in great condition are still generating strong offers—and in many cases, multiple offers.
Market Speed: Nearly Half of Homes Sell in a Week
Even with the rise in average days on market to 54, 47.4% of homes sold in the last 30 days went pending within the first 7 days. When you include homes sold in the first 30 days, the number jumps to 67.2%, showing that buyers are still acting quickly when they see value. The pace may be slowing slightly, but urgency remains for the right listings.
Buyer Strength: Conventional and Cash Buyers Dominate
In the past month, 64.7% of buyers in Eugene purchased homes using conventional loans, and another 25% paid in cash. That’s nearly 90% of buyers coming in with strong financial positions. While FHA and VA loans are still present in the market, the dominance of cash and conventional financing reflects a confident and qualified buyer pool, which is great news for sellers who prioritize fewer financing contingencies.
Final Thoughts on the Real Estate Market
The Eugene, Oregon real estate market continues to perform steadily as we close out 2025. Though there are early signs of a seasonal cooldown—longer days on market, minor inventory increases, and more measured buyer behavior—the overall climate remains favorable for sellers, especially for homes that are well-prepared and appropriately priced.
If you're considering listing your home in Eugene, understanding the current average home prices, market timing, and buyer behavior can make all the difference. Properties in prime locations, like near the University of Oregon, are still seeing near-list price offers, showing the importance of local desirability in today’s market.
Market trends
| Eugene Zip Codes | Inventory Month Supply | List vs. Sold Price | Homes Sold 0-30 Days on Market | Avg Sold Price | Sold Price perSq Foot | Average Days on Market | Available Homes for Sale |
|---|---|---|---|---|---|---|---|
| Eugene | 2.66 | 95.0% | 47.4% | $537,508 | $290 | 54 | 309 |
| 97401 | 2.65 | 90.1% | 47.1% | $647,285 | $310 | 81 | 45 |
| 97402 | 2.97 | 93.8% | 33.3% | $441,222 | $277 | 69 | 89 |
| 97403 | 2.63 | 99.4% | 50.0% | $643,381 | $289 | 46 | 21 |
| 97404 | 3.36 | 97.6% | 42.9% | $489,886 | $274 | 31 | 47 |
| 97405 | 1.98 | 97.1% | 59.5% | $539,500 | $288 | 38 | 83 |
| 97408 | 5.00 | 90.7% | 40.0% | $689,200 | $325 | 81 | 25 |
October 2025
Market overview
Eugene is in a Healthy Sellers Market. The Eugene real estate market currently has 341 homes available, with 164 now under contract, and 158 homes sold in the past 30 days. Inventory has tightened since last month and fewer new listings are arriving as we head into the holiday season—shrinking supply even as buyers continue to shop. Activity remains steady: many homes are taking more than a month to secure offers, which is creating room for negotiations, while well-priced, move-in-ready listings still attract swift attention. Overall, this keeps Eugene’s conditions tilted toward sellers, consistent with a low months-of-inventory environment for the area.
Key Market Insights
Market Type: Months of Inventory (MOI) is 2.16 — a Healthy Sellers Market. There are 341 homes currently available.
Future Market Trends: Potential Market Direction indicates a Healthy Sellers Market, showing signs of remaining in a sellers-leaning environment, with 164 homes currently in contract.
Offer Strength: 20.9% of homes sold above list price in the last 30 days. Homes that went under contract in the first week averaged a 99.7% list-to-sold price ratio versus 97.3% for those accepting offers in days 8–30, underscoring the value of strong week-one pricing and presentation. Overall, the list-to-sold ratio averaged 95.4% last month—about 4.3 percentage points lower than week-one sales—signaling buyers still have room to negotiate on longer-sitting listings.
Market Speed: 29.1% of last month’s sold homes went pending within 7 days, and 51.3% were under contract within 30 days. The overall average days on market was 47, reflecting a steady pace where well-priced homes move quickly while others take longer, giving buyers leverage on listings past the first month.
Buyer Strength: Conventional loans led purchases at 58.2% (a healthy, finance-ready buyer pool). Cash buyers accounted for 22.2%—notable support at the high end—while FHA/VA/Other made up the balance, indicating a diverse set of active buyers.
Market trends
| Eugene Zip Codes | Inventory Month Supply | List vs. Sold Price | Homes Sold 0-30 Days on Market | Avg Sold Price | Sold Price perSq Foot | Average Days on Market | Available Homes for Sale |
|---|---|---|---|---|---|---|---|
| Eugene | 2.16 | 95.4% | 51.3% | $552,306 | $290 | 47 | 341 |
| 97401 | 2.33 | 96.2% | 62.5% | $586,002 | $306 | 47 | 56 |
| 97402 | 2.34 | 95.7% | 52.6% | $425,724 | $285 | 36 | 89 |
| 97403 | 1.11 | 93.5% | 44.4% | $738,692 | $304 | 78 | 20 |
| 97404 | 1.58 | 96.7% | 48.5% | $487,529 | $272 | 44 | 52 |
| 97405 | 2.75 | 94.0% | 41.7% | $651,696 | $281 | 55 | 99 |
| 97408 | 3.00 | 99.0% | 77.8% | $525,683 | $337 | 18 | 27 |
September 2025
Market overview
Eugene’s single-family home market is currently a Healthy Sellers Market. Eugene, Oregon currently has 388 homes on the market, with 191 homes in contract and 139 homes sold in the past 30 days. With roughly 2.8 months of inventory, sellers retain the edge, but buyers have a bit more room to evaluate options than during peak frenzy periods. Overall activity suggests steady demand for well-priced, move-in-ready homes.
Key Market Insights
- Market Type: Months of Inventory sits at about 2.79, which corresponds to a Healthy Sellers Market. There are 388 total available homes within this selected market.
- Future Market Trends: The leading indicators point to the market showing signs of remaining a Healthy Sellers Market, with 191 homes currently in contract.
- Offer Strength: In the last 30 days, 22.3% of sales closed above list price. Homes that secured offers in the first week averaged ~101.2% of list, compared with ~98.5% for homes going under contract in days 8–30—highlighting the advantage of strong early pricing and presentation. Overall, the average sale was ~95.6% of list. Notably, the average sold price eased month over month from about $588,000 to just under $544,000, and the average price per square foot dipped from ~$313 to ~$298.
- Market Speed: About 29.5% of last month’s sales went under contract within 7 days, and 53.2% were under contract within 30 days. The average days on market hovered around 52, reflecting a moderate pace where standout listings still move quickly.
- Buyer Strength: Conventional financing remains the majority of purchases and signals healthy, qualified demand, while cash buyers made up a notable share (around the upper-20% range), reinforcing overall buyer strength in the area.
Market trends
| Eugene Zip Codes | Inventory Month Supply | List vs. Sold Price | Homes Sold 0-30 Days on Market | Avg Sold Price | Sold Price perSq Foot | Average Days on Market | Available Homes for Sale |
|---|---|---|---|---|---|---|---|
| Eugene | 2.79 | 95.6% | 53.2% | $543,709 | $298 | 52 | 388 |
| 97401 | 2.82 | 97.7% | 59.1% | $588,864 | $300 | 40 | 62 |
| 97402 | 4.22 | 97.5% | 69.6% | $428,626 | $299 | 44 | 97 |
| 97403 | 1.38 | 94.8% | 43.8% | $694,672 | $285 | 73 | 22 |
| 97404 | 2.21 | 96.5% | 48.3% | $443,365 | $302 | 51 | 64 |
| 97405 | 2.76 | 94.2% | 54.8% | $556,379 | $301 | 48 | 116 |
| 97408 | 3.33 | 94.6% | 33.3% | $792,322 | $305 | 80 | 30 |
August 2025
Market overview
The Eugene market is currently in a Healthy Sellers Market. There are 390 available homes on the market, 178 homes currently pending, and 162 homes sold in the past 30 days. Months of Inventory slightly decreased to 2.41 months from 2.43 last month, while the number of available homes remained steady, closing August with 390 compared to 384 at the end of July. This modest tightening indicates stable yet favorable conditions for sellers, with buyer demand keeping pace with available supply.
Key Market Insights
Market Type: With 2.41 Months of Inventory, the market is classified as a Healthy Sellers Market, supported by 390 available homes currently on the market.
Future Market Trends: The market is showing signs of maintaining its Healthy Sellers Market standing, with 178 homes currently in contract. The consistency in available homes and pending contracts suggests steady activity into the coming months.
Offer Strength: In the past 30 days, 27.8% of homes sold above list price. Homes going under contract in the first week achieved an average of 102.8% of list price, while the overall average was 96.3%. This drop underscores the importance of attracting strong offers early. Compared to homes sold in 8–30 days, the premium for week-one contracts remains a clear advantage for sellers who list competitively.
Market Speed: 27.8% of homes sold in the past month went pending within the first 7 days, and another 32.7% sold between 8–30 days, meaning over 60% of homes sold in less than a month. The overall average days on market was 45, reflecting a balanced yet active pace where well-priced homes move quickly.
Buyer Strength: Buyer financing remains solid, with 55.6% of homes purchased using conventional loans. Cash buyers represented 22.8% of sales, a significant share indicating strong, well-qualified buyer activity. FHA and VA buyers made up a smaller portion of the market, highlighting stability in buyer strength and access to financing.
Market trends
| Eugene Zip Codes | Inventory Month Supply | List vs. Sold Price | Homes Sold 0-30 Days on Market | Avg Sold Price | Sold Price perSq Foot | Average Days on Market | Available Homes for Sale |
|---|---|---|---|---|---|---|---|
| Eugene | 2.41 | 96.3% | 60.5% | $588,365 | $313 | 45 | 390 |
| 97401 | 2.00 | 96.0% | 51.9% | $596,936 | $316 | 38 | 54 |
| 97402 | 3.83 | 96.3% | 48.3% | $420,774 | $281 | 47 | 111 |
| 97403 | 1.67 | 94.9% | 66.7% | $769,423 | $307 | 36 | 25 |
| 97404 | 2.19 | 98.9% | 67.7% | $457,353 | $298 | 43 | 68 |
| 97405 | 2.45 | 95.5% | 63.6% | $607,533 | $305 | 40 | 108 |
| 97408 | 1.63 | 96.7% | 68.8% | $909,038 | $385 | 80 | 26 |
Common questions
- How much does a house cost in Eugene, Oregon?
- In September 2026 the average home price in Eugene was $583,800 and the median was $520,000. The median is the better number to plan around — half of the houses sold for less than that, so a few expensive sales cannot drag it the way they drag an average.
- How long does it take to sell a house in Eugene?
- In September 2026, half of the houses that sold went under contract within 20 days of listing; the average was 45 days on market, pulled up by a few that sat for months. Add roughly another month for closing after that. A well-priced house in good shape sells near the middle figure; an overpriced one can sit.
- Is it a good time to sell a house in Eugene?
- Eugene sat at 2.3 months of supply in September 2026, and anything under about four months favours the seller. Houses were selling at 99.4% of asking. That is a market that rewards pricing a house correctly on day one rather than starting high and cutting later.
- Is now a good time to buy a house in Eugene?
- There is less competition than the low-supply years, and at 45 days on market you generally have time to see a house twice and get an inspection rather than deciding in an afternoon. What you can afford still turns mostly on the mortgage rate the week you buy, not on the asking price.
- Is the Eugene housing market going to crash?
- Nothing in this month's numbers looks like a crash. A crash needs far more houses for sale than buyers; Eugene is at 2.3 months of supply, and a balanced market is about five to six. Prices can still flatten or dip — that is not the same as a collapse, and the monthly figures above are what we watch.